

CoreLogic - June Home Value Index Report

REG TAS + 0.9%
REG TAS + 0.9%
REG WA + 0.6%
REG SA + 1.3%
REG QLD + 0.6%
REG VIC + 0.4%
REG NSW + 0.4%
ACT -0.1%
DRW + 0.5%
HBA + 0.3%
PER + 0.8%
ADE + 1.8%
BNE + 0.8%
MEL -0.7%
SYD - 1.0%
Month
REG TAS + 0.9% REG TAS + 0.9% REG WA + 0.6% REG SA + 1.3% REG QLD + 0.6% REG VIC + 0.4% REG NSW + 0.4% ACT -0.1% DRW + 0.5% HBA + 0.3% PER + 0.8% ADE + 1.8% BNE + 0.8% MEL -0.7% SYD - 1.0% Month
REG TAS + 3.9%
REG WA + 2.5%
REG SA + 6.2%
REG QLD + 4.5%
REG VIC + 2.1%
REG NSW + 3.3%
ACT + 2.2%
DRW+ 2.2%
HBA + 0.3%
PER + 2.7%
ADE + 5.7%
BNE + 4.6%
MEL - 0.8%
SYD - 1.4%
QUARTER
〰️
REG TAS + 3.9% REG WA + 2.5% REG SA + 6.2% REG QLD + 4.5% REG VIC + 2.1% REG NSW + 3.3% ACT + 2.2% DRW+ 2.2% HBA + 0.3% PER + 2.7% ADE + 5.7% BNE + 4.6% MEL - 0.8% SYD - 1.4% QUARTER 〰️
REG TAS+ 7.8%
REG WA + 4.2%
REG SA + 11.0%
REG QLD + 8.6%
REG VIC + 5.0%
REG NSW+ 6.7%
ACT + 4.3%
DRW + 3.1%
HBA + 2.7%
PER + 3.6%
ADE + 9.7%
BNE + 9.1%
MEL - 0.8%
SYD - 0.9%
YEAR TO DATE
〰️
REG TAS+ 7.8% REG WA + 4.2% REG SA + 11.0% REG QLD + 8.6% REG VIC + 5.0% REG NSW+ 6.7% ACT + 4.3% DRW + 3.1% HBA + 2.7% PER + 3.6% ADE + 9.7% BNE + 9.1% MEL - 0.8% SYD - 0.9% YEAR TO DATE 〰️
"CoreLogic Home Value Index records the first national fall since September 2020, as declines accelerate across Sydney and Melbourne in May" -
Tim Lawless - CoreLogic Australia
Reserve Bank of Australia's cash rate increase of 0.5% has taken the heat out of the property market across the nation and we have now seen the peaks in all states and territories, as well as capital cities and regional areas.

Sydney $1,220,836, Melbourne $806,196 and Canberra $940,026 have seen a drop in dwelling values. It is to be noted that these three cities have the three highest median home values. Brisbane's median dwelling value was $779,895, and Adelaide's at $628,744 remain strong; however, both cities have reached their peaks with combined capitals $829 390, Combined Regionals 597, 074. The National Median Dwelling Value is $752 707.
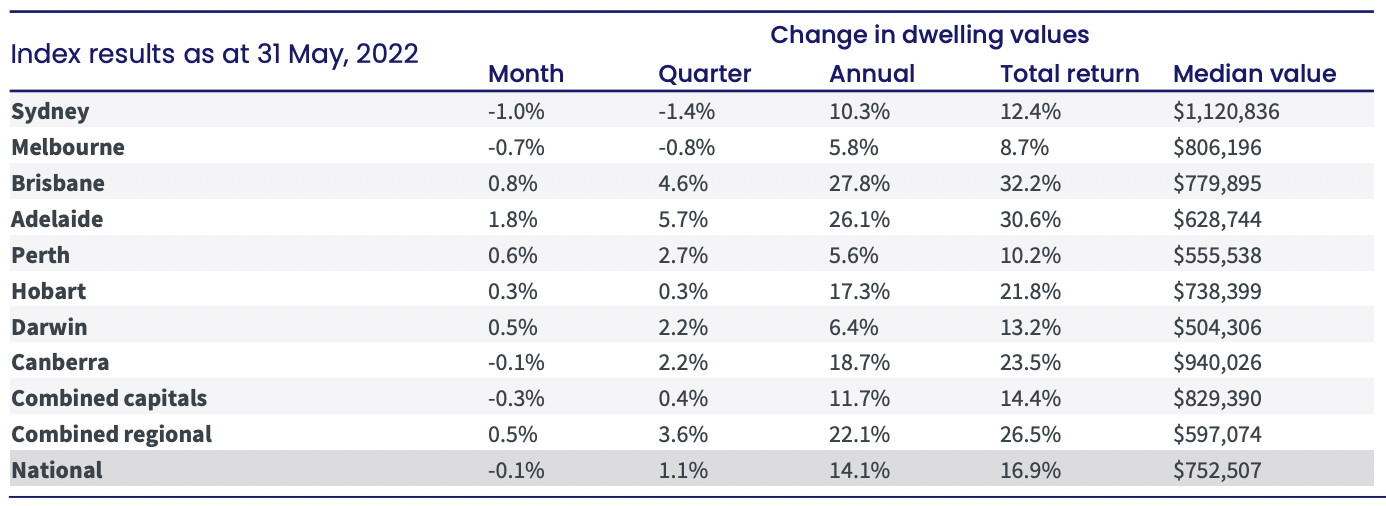
Housing affordability and serviceability for new home loans are playing a crucial role in the slowdown of the property market in the Major Captial Cities. Sydney and Melbourne were the first to slow. It is predicted that Brisbane and Adelaide will follow next with inflation starting to bite and with the Reserve cash Rate being at now 0.85%, with more rate rises expected in July and later in the year to bring the cash rate up to 3% in 2023. Times of easy money has gone, and home loans will be harder to service in the future. The tighting of lending will drive down stock as there will be less movement in the lending market.
“We are likely to see falls in housing values become more widespread as mortgage rates trend higher.'“
Tim Lawless - CoreLogic

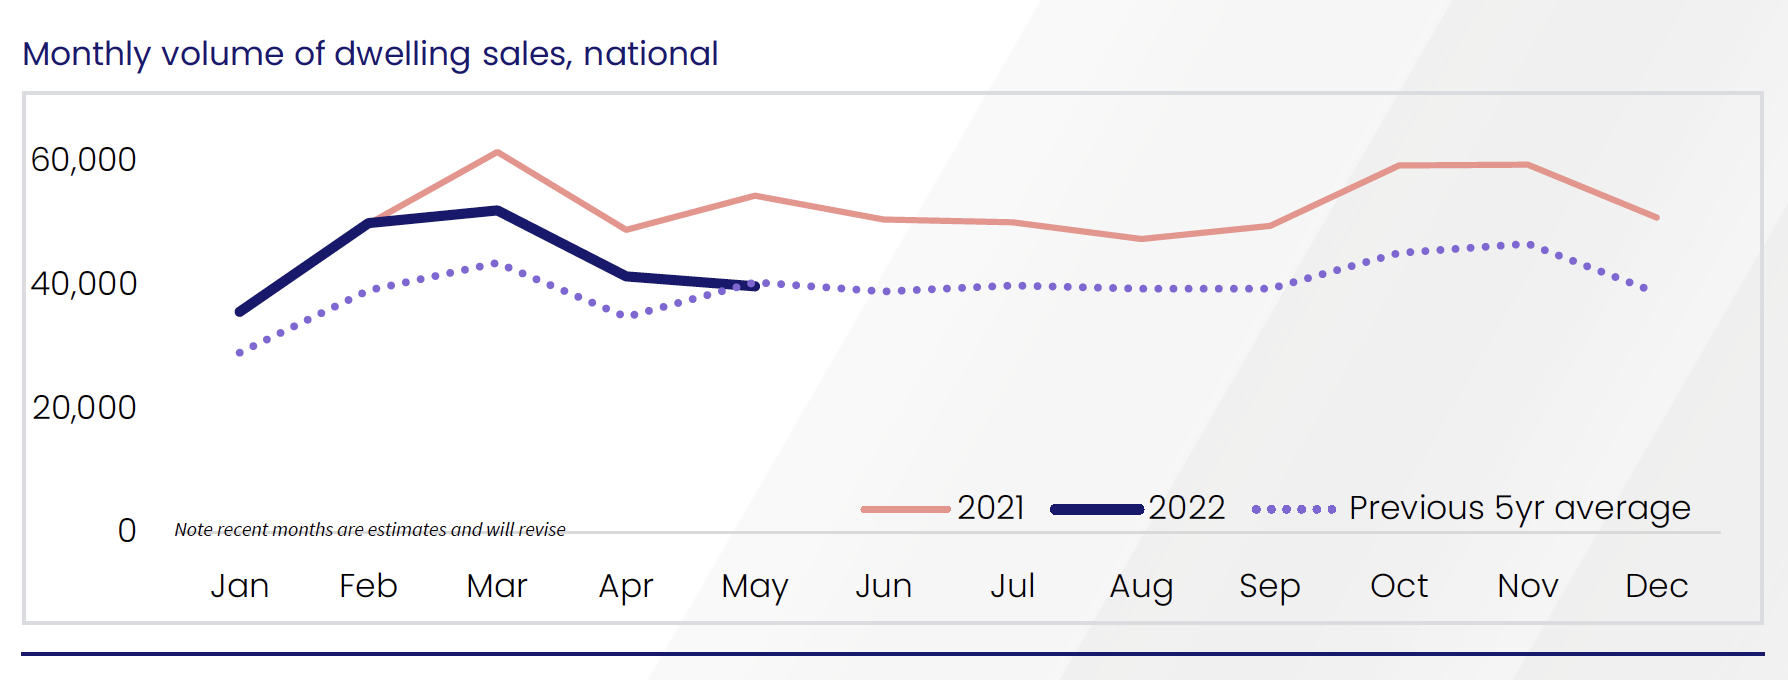
" Settled sales estimates from CoreLogic indicate dwelling sales over the three months to the end of May were -19% lower than at the same time a year ago. A similar trend can be seen in home lending data from the ABS, where the number of new mortgage commitments is also trending lower.”
-Tim Lawless CoreLogic Australia
Is it Turning into a Buyer's Market?
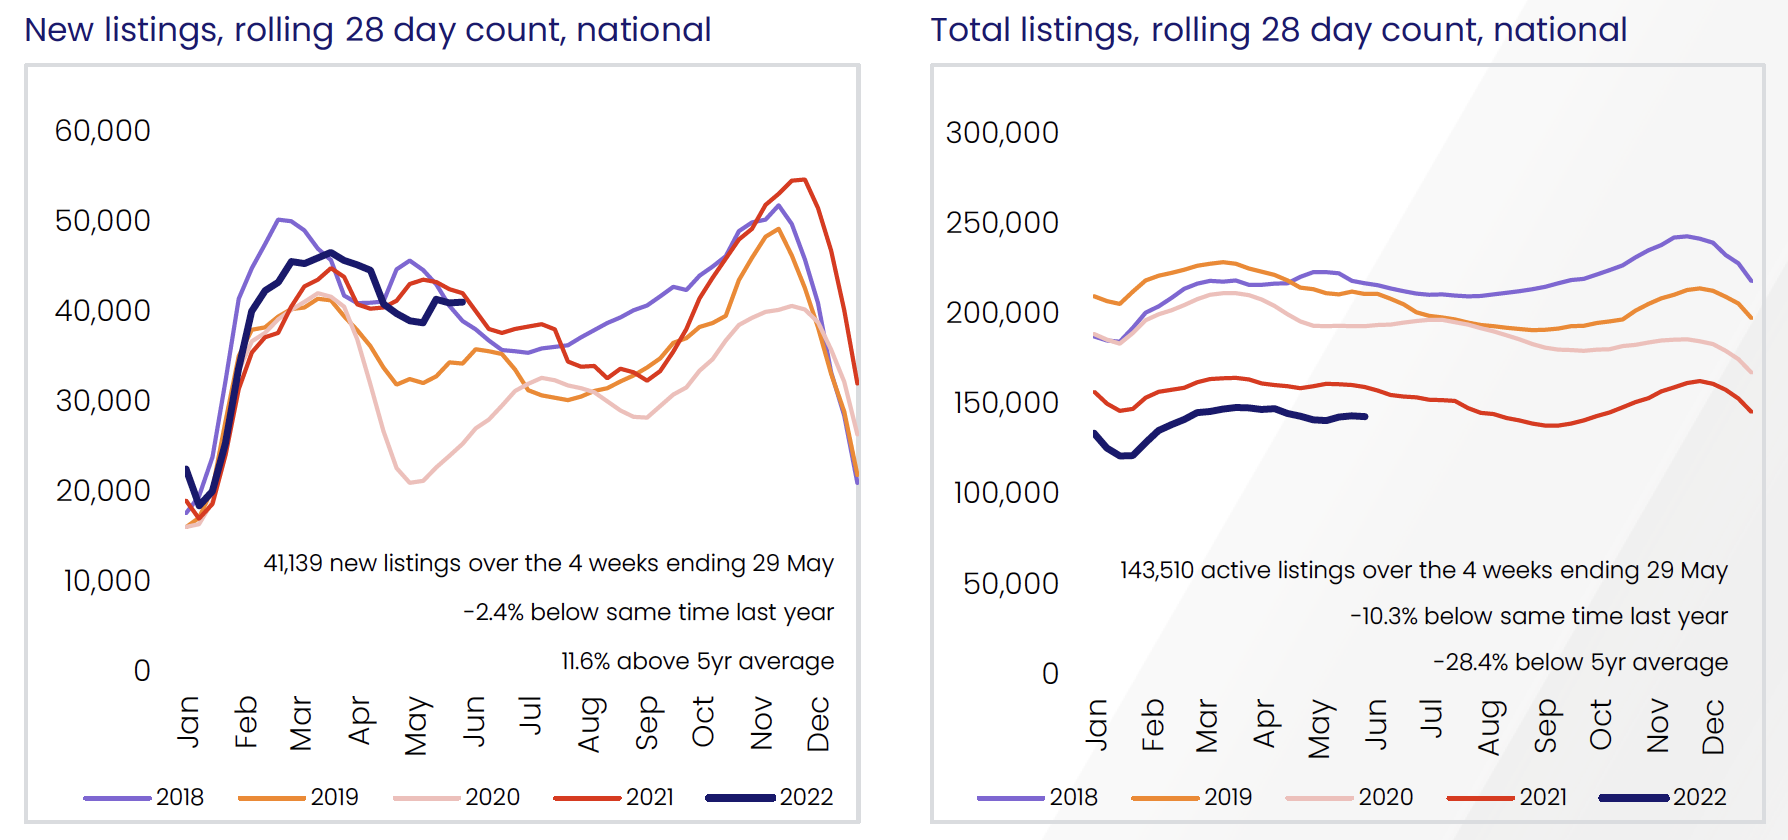
41,139 New Listings over the four weeks ending 29th May, being 2.4% below the same time last year and 11.6% above the 5-year average; however, comprehensive listings are still -28.4% of the national five-year average and 10.3% below the same time last year. Stock is limited on the market, but buyers will have more power to bargain on the price and terms of the contract.
The above graph shows that the market has returned to the national five-year average and is well off the peak for the year. The chart indicates that we will see another rise over the next sell period between September, October, and November and ease off again in December for the Christmas Break. Will this trend happen? Or will the market remain flat following a possible interest rate rise in July and the risk of higher inflationary pressure?
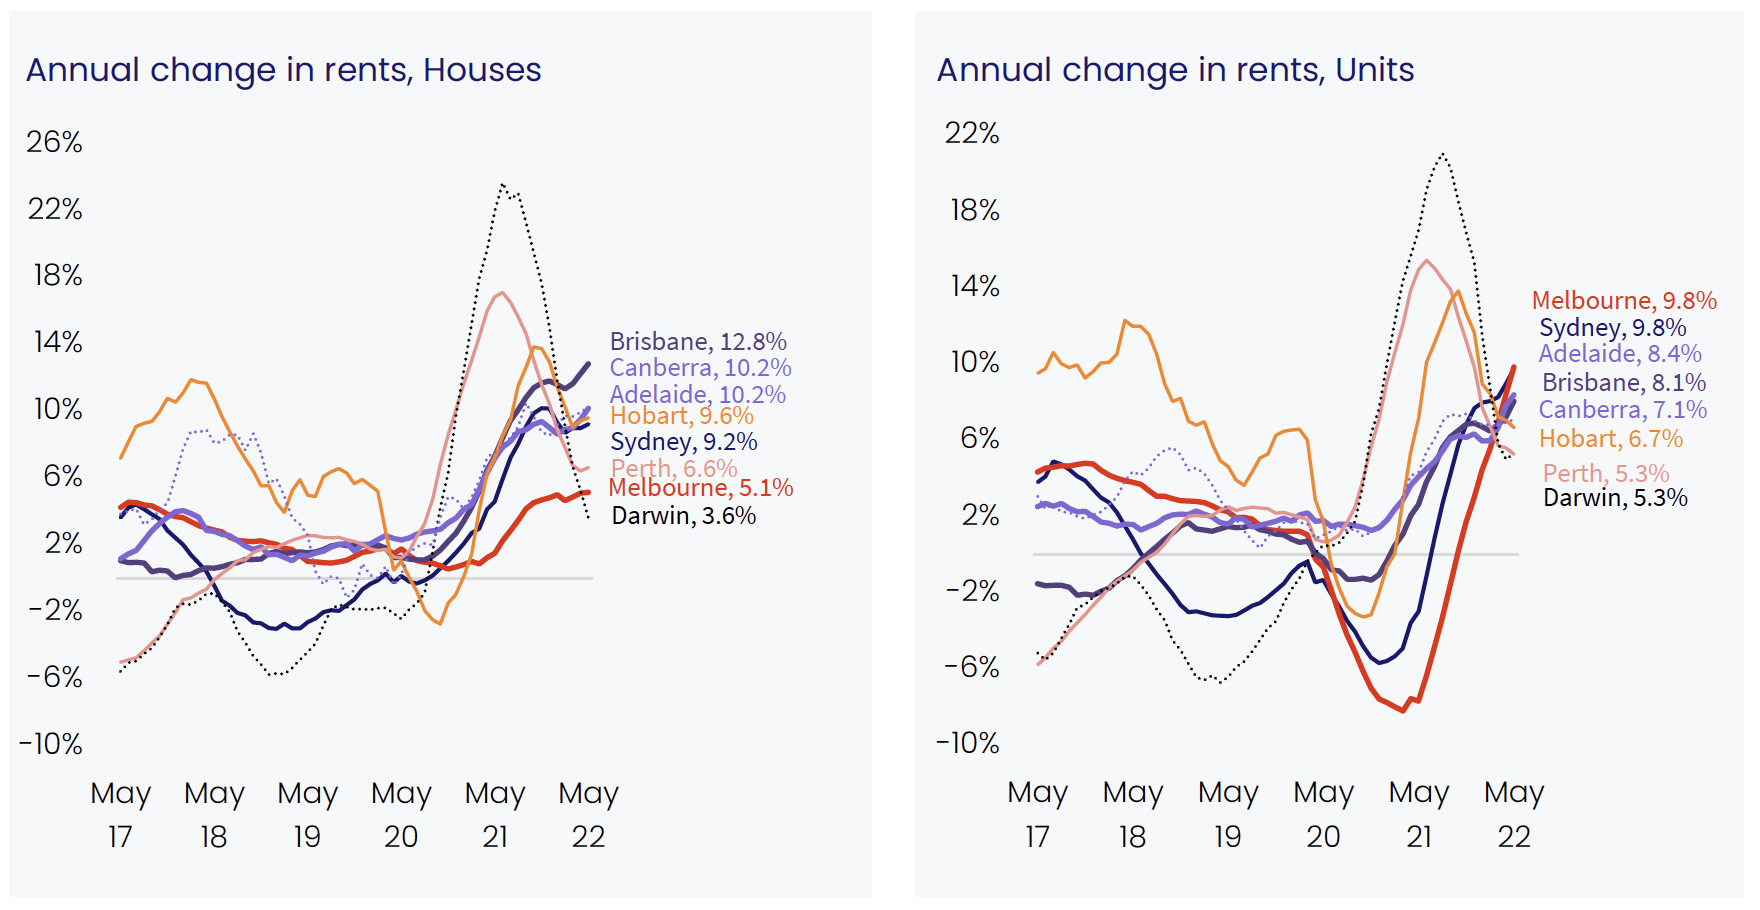
The Annual rental market is still strong and trending upwards as more demand with returning overseas migration students for all dwellings. In regional areas, rental properties have transferred ownership and become owner-occupiers or holiday rentals.
For Houses;
Brisbane has seen the most significant jump in rental prices, a whopping 12.8%, followed by Canberra, Adelaide 10.2%, Hobart at 9.6%, Sydney 9.2%, Perth 6.6%, Melbourne 5.1%, and Darwin 3.6%
For Units;
Melbourne and Sydney lead the way with an annual change in rental income with 9.8%, followed by Adelaide 8.4%, Brisbane 8.1%, Canberra 7.1%, Hobart and Perth at 5.3%.
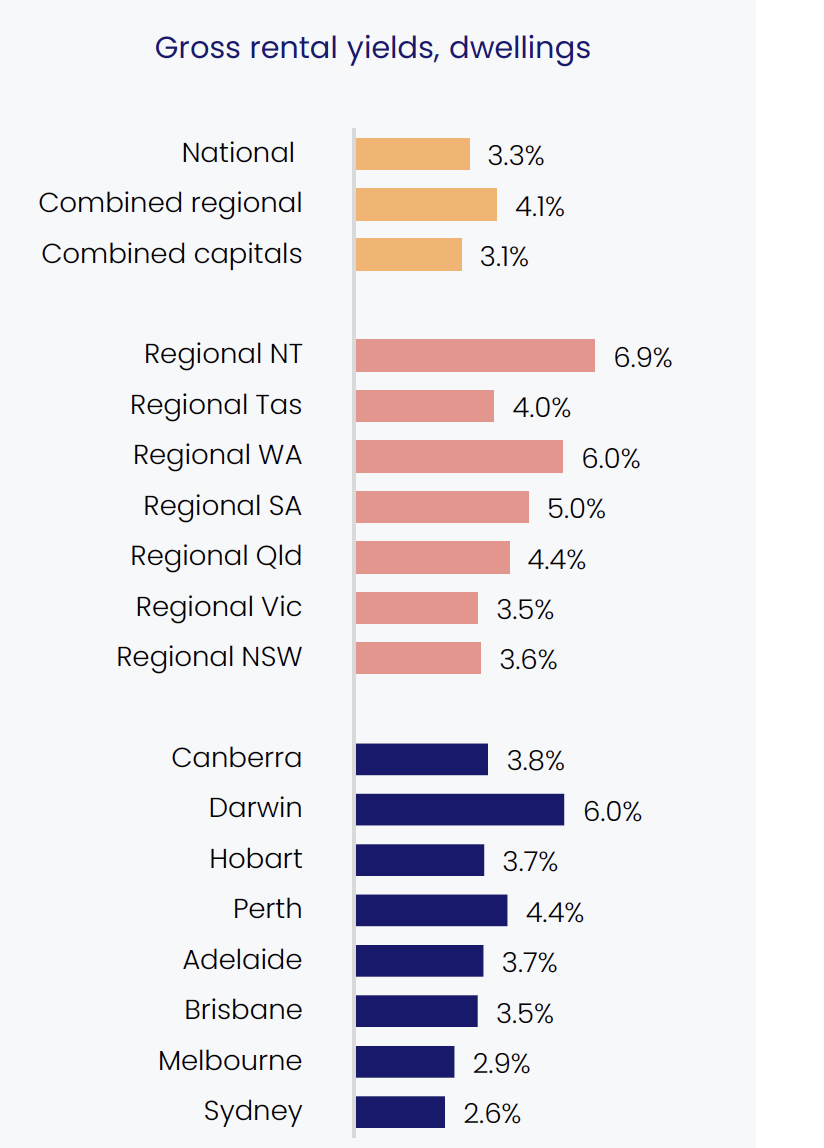
Capital City Rental Yields
Darwin 6.0%
Perth 4.4%
Canberra 3.8%
Adelaide, Hobart 3.7%
Brisbane 3.5%
Melbourne 2.9%
Sydney 2.6%
“Despite the upwards trajectory, yields remain remarkably low in both cities, but a recovery back to average levels may be relatively quick if housing values continue to fall while rents maintain this growth trajectory,”
- Tim Lawless Corelogic

The Expatriate always tries to make sure all information is accurate. However, when reading our website, please always consider our Disclaimer policy.
THE EXPATRIATE Team
Join the Club, Stay Informed, Grow Your Wealth, Buy Property, Return Home, Enjoy Life, Expat Life.
The Expatriate always tries to make sure all information is accurate. However, when reading our website, please always consider our Disclaimer policy.