CoreLogic AU - HVI +0.7 August 2023 Growth Easing in Regions, SYD - New Listings Rising
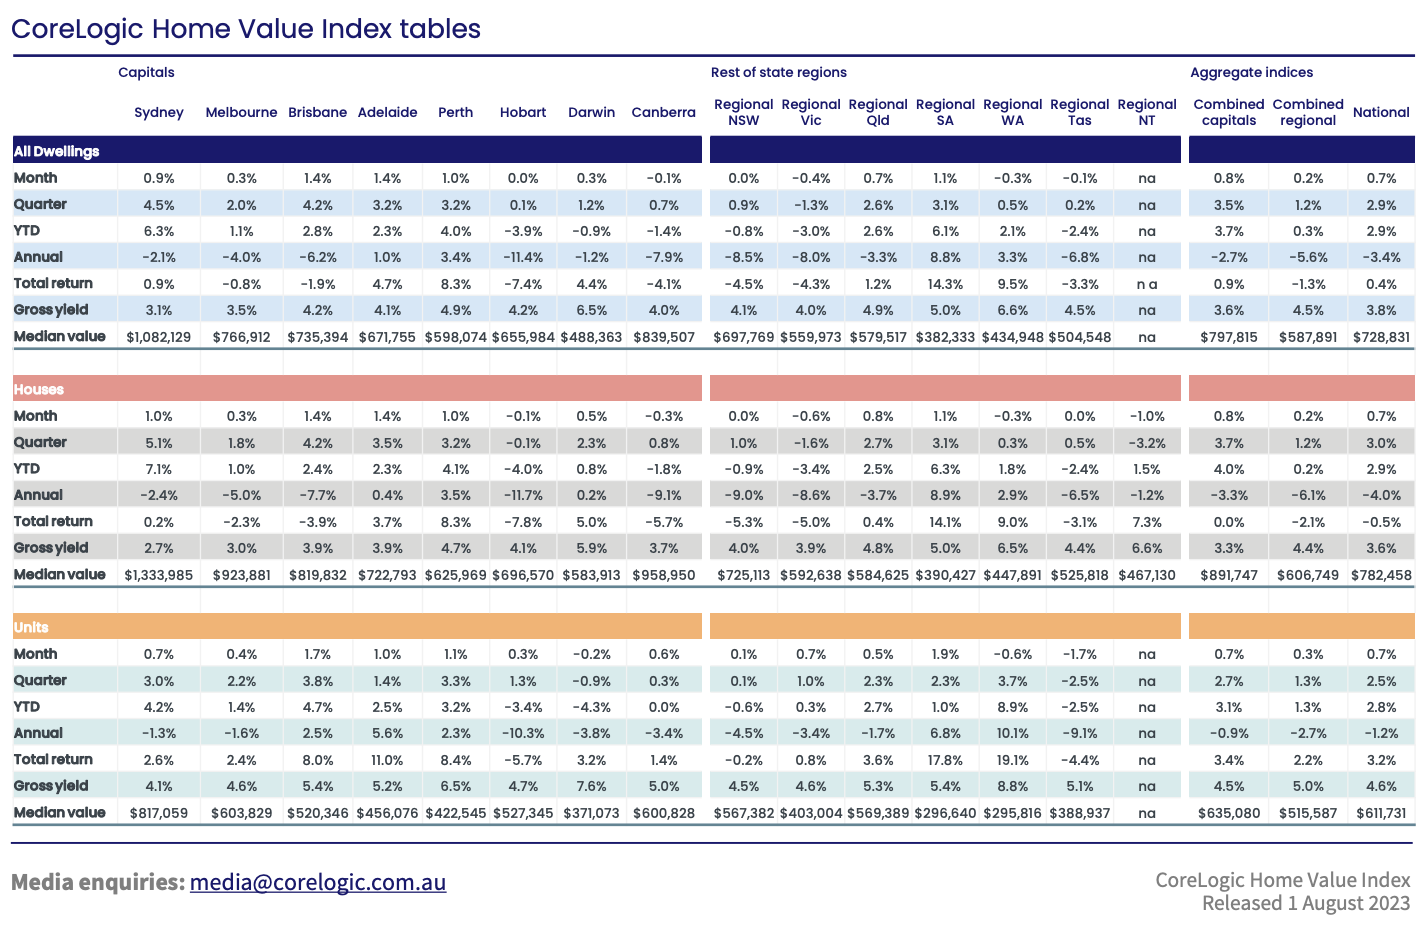
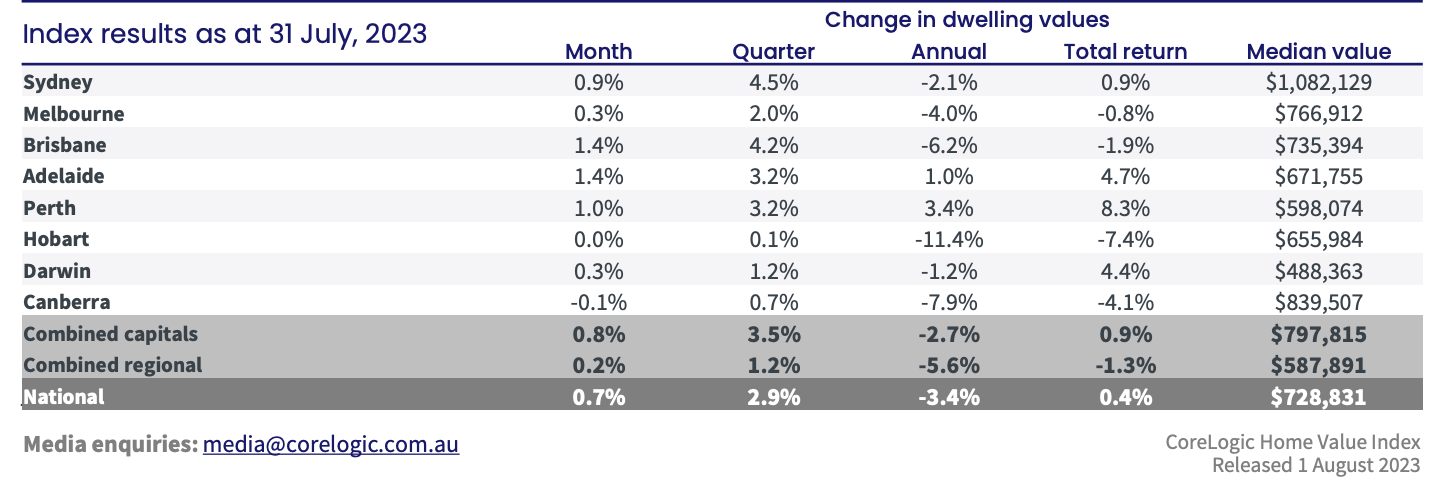
Finally, buyers have some stock returning to the market, with growth in Sydney’s stock level up +18%. Regions are also experiencing an easing in HVI as new listings are rising. The nation experienced its 5th consecutive growth month in CoreLogic Australia Home Value Index HVI on August 1st, with dwelling prices increasing nationally by +0.7%, Cities recording +0.8%, and regional growth slowing to+0.2%.
Leading the way for July were Adelaide and Brisbane, both recording an increase in HVI +1.4%. Perth was strong for the month with a 1.0% increase, as was Regional SA, with 1.1% growth and is experiencing its cynical high. Sydney and Brisbane have experienced the most robust growth for the quarter, recording 4.5% and 4.2%, respectively. The softest markets were Canberra, -0.1 for the month and 0.7% for the quarter and Hobart, 0.0% for the month and 0.1% for the quarter.
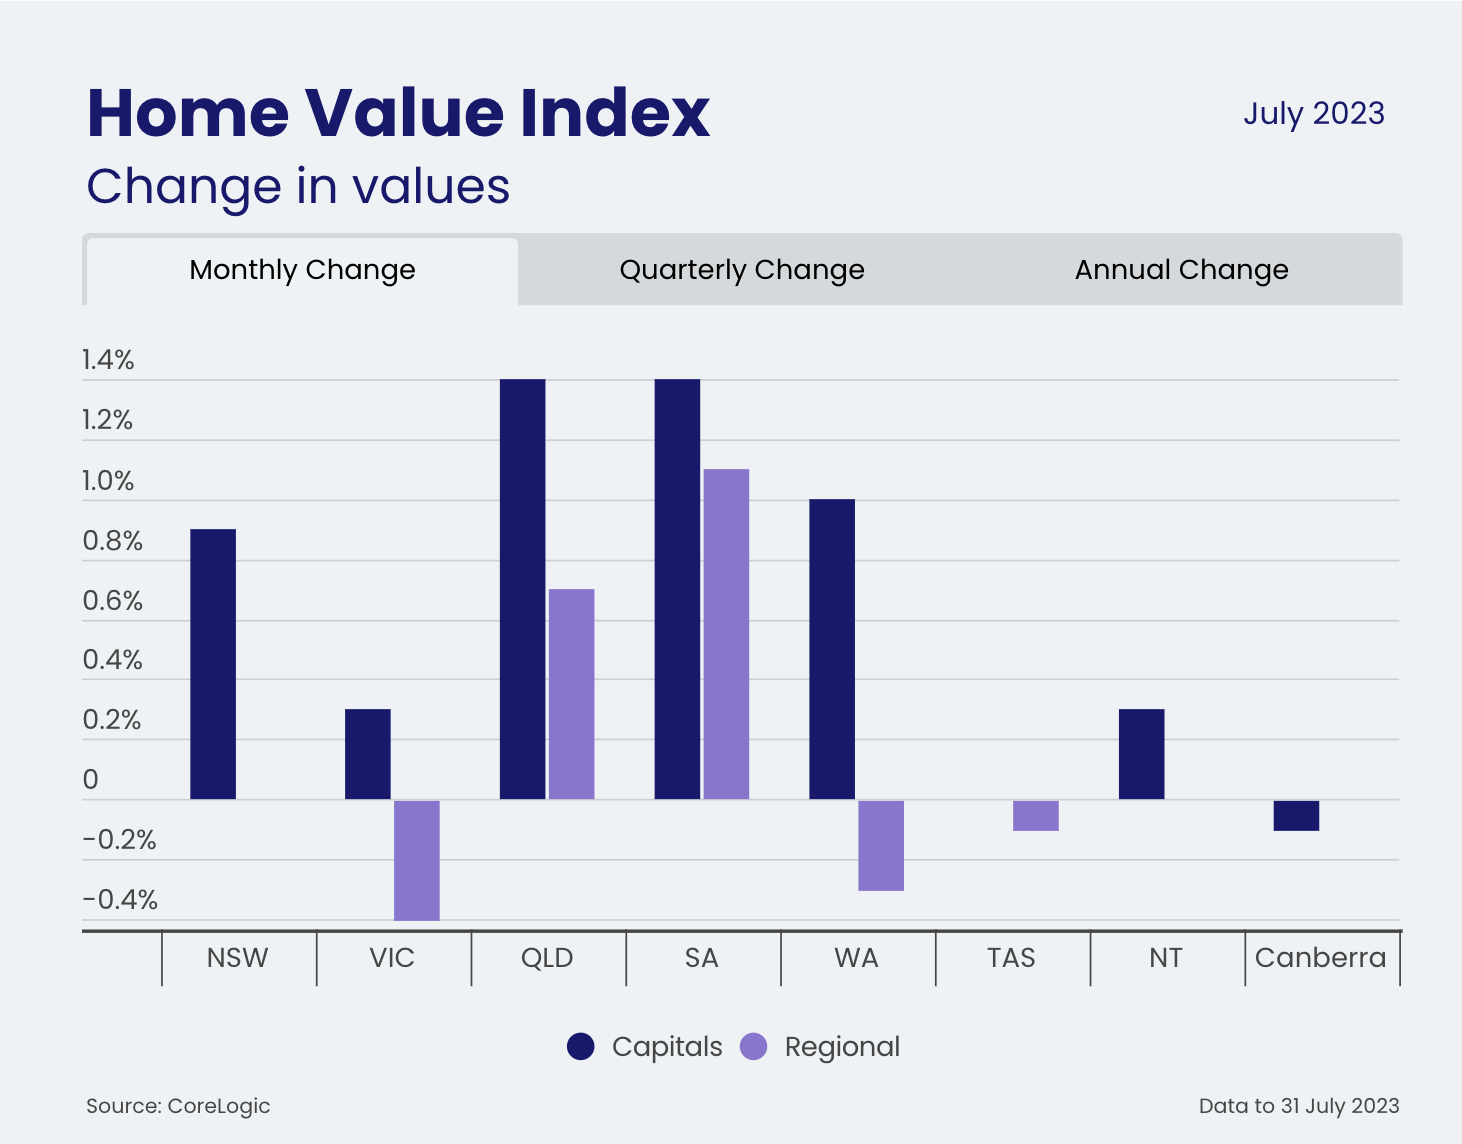
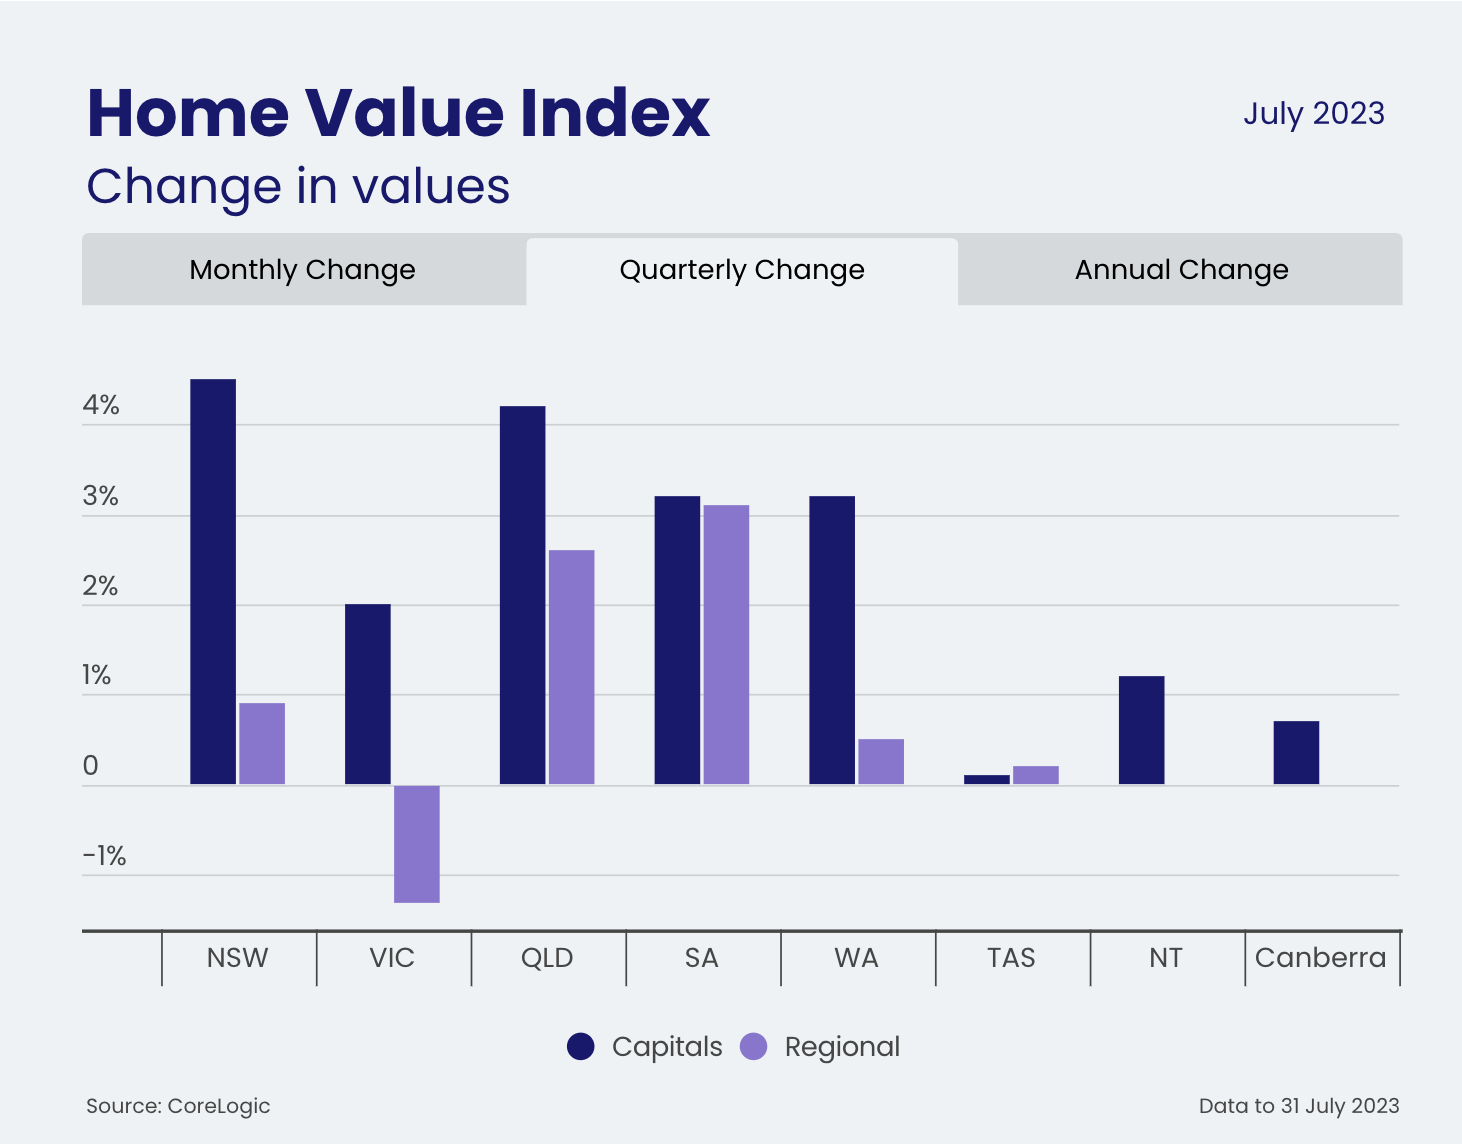
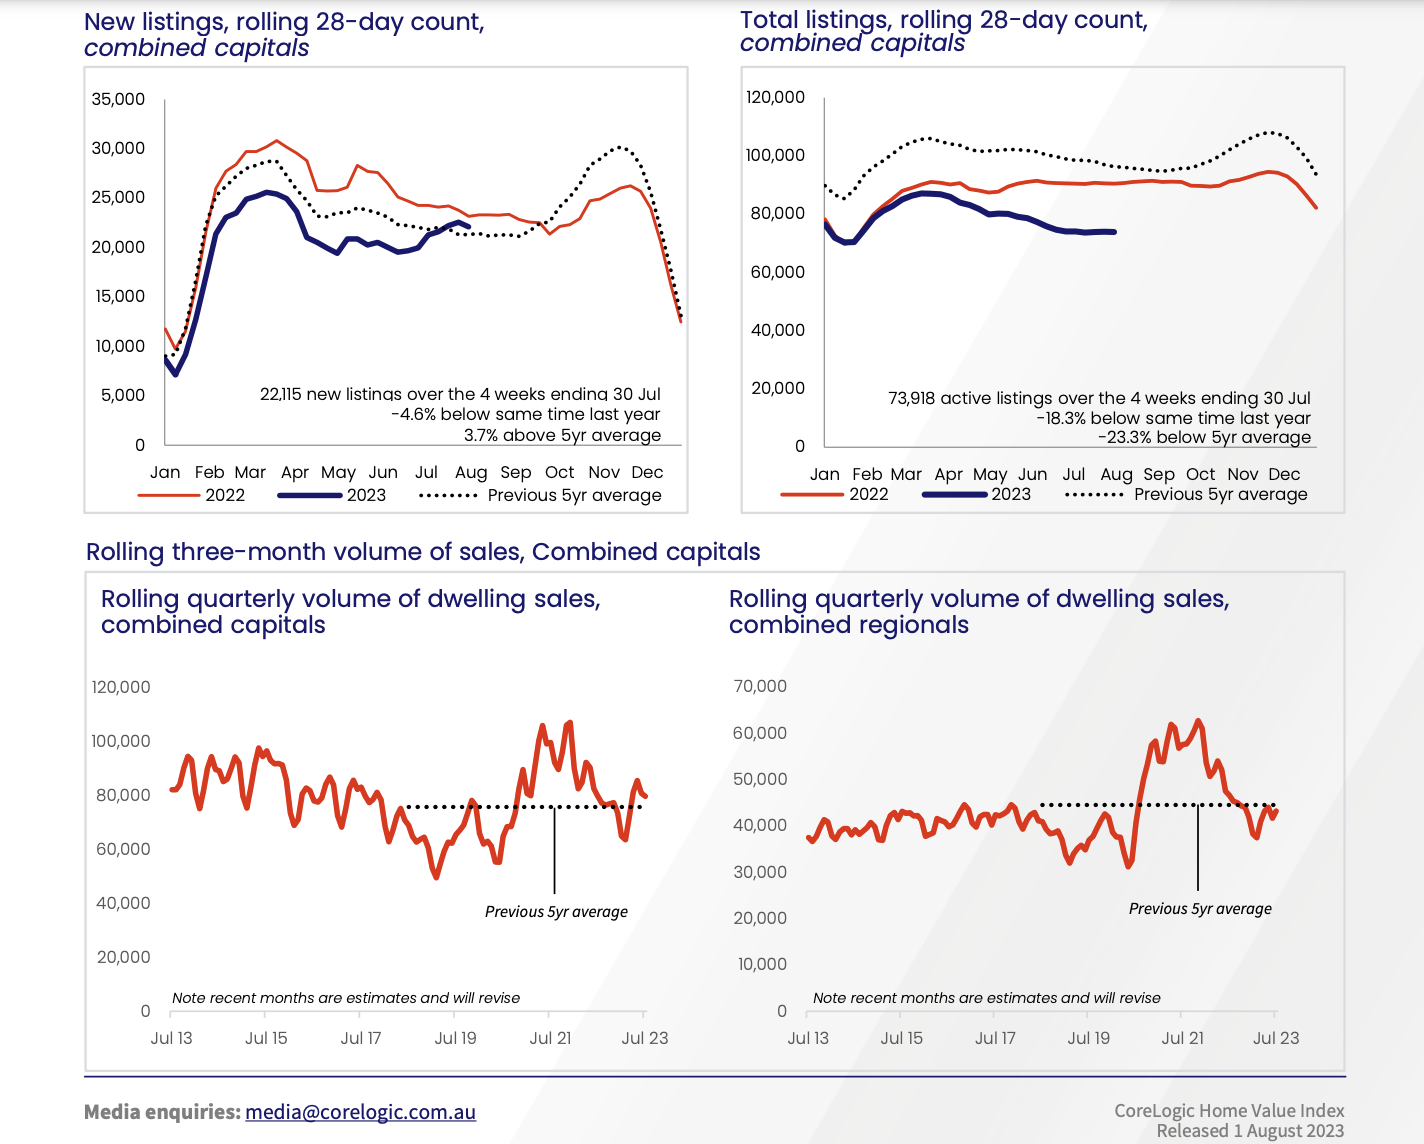
CoreLogic Research Director, Tim Lawless, noted the most substantial reduction in growth has occurred in Sydney. “After leading the upswing, the monthly pace of growth in Sydney housing values has halved from a recent high of 1.8% in May to 0.9% in July. Sydney has also seen a significant rise in the number of fresh listings added to the market, 9.9% higher than the same time last year and 18.0% above the previous five-year average. An increased flow of new listings provides more choice and may be working to reduce some of the urgency felt among prospective buyers,” he said.
Source CoreLogic Australia HVI 1st August 2023
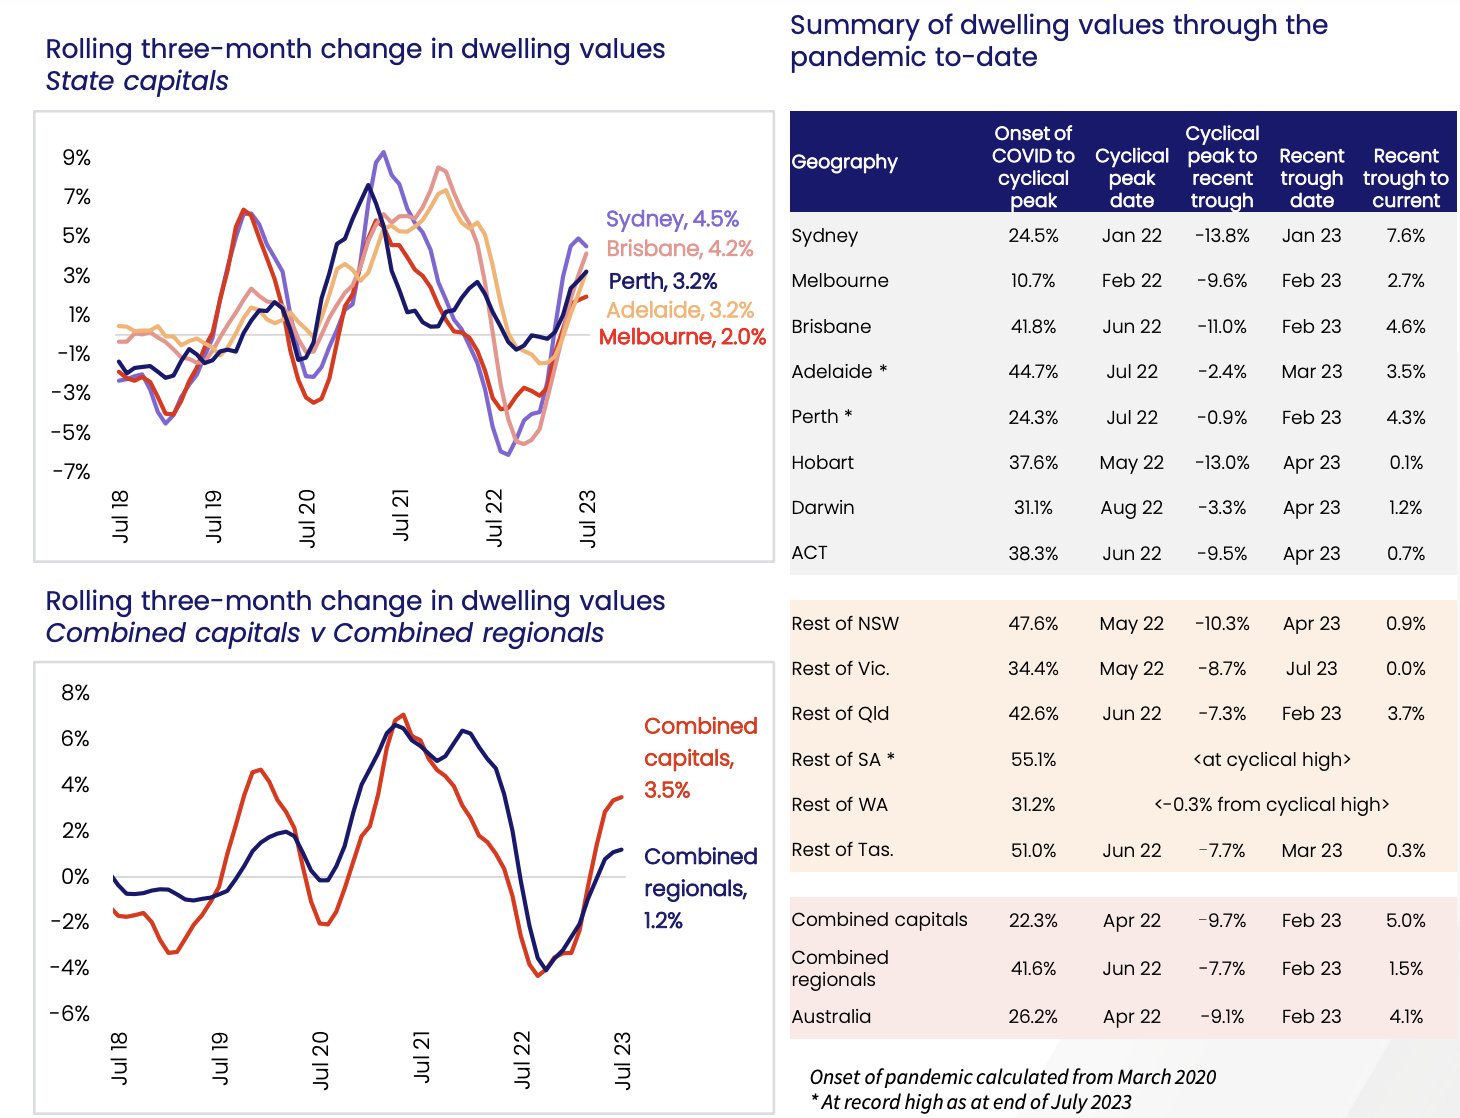
How are the cities rebounding from their recent troughs?
The nation has recovered 5% from its February 2023 trough, with Sydney leading the way with the most significant rebound from its losses of -13.8%, recovering 7.6%. Brisbane is the next most considerable Capital City to rebound from its -11% trough, accelerating its rebound and bouncing back 4.6% from its trough in June 2022. The most resilient of the capital cities has been Adelaide, the star performer during the Covid peak with a gain of +44%, to the trough of -2.4%, with an upswing of +3.5%. Perth was a quiet archiver, with fewer gains +24.3% and more minor losses than all other capital cities, experiencing a -0.9% trough yet recovering +4.3%. Perth joins Adelaide to be currently at its cyclical peak.
What about the regions?
With the mass exodus from Capital Cities during Covid, accelerating the “technology-driven, work from home” culture, we are seeing even the Online Meeting Platforms themselves, like Zoom, request that their workers spend a minimum of hours a week in the office. The shift in culture and interest rates may pressure those who purchased a holiday house or second home in the regional areas.
To many sport-loving Australians, on the 18th of July, 2023, Victorian Premier Daniel Andrews did the unthinkable by cancelling the 2026 Commonwealth Games that was sold to the Victorian people as the “Regional Games”. Instead, the ever-so-savvy, Gold Coast (GC) Mayor, Tom Tate, has put the GC into the ring to host the iconic games on the condition that Federal Funding is redirected to them. The region of South East Queensland will potentially host both the 2026 Commonwealth Games and the 2032 Olympic Games.
Who are the best performers in the Regions?
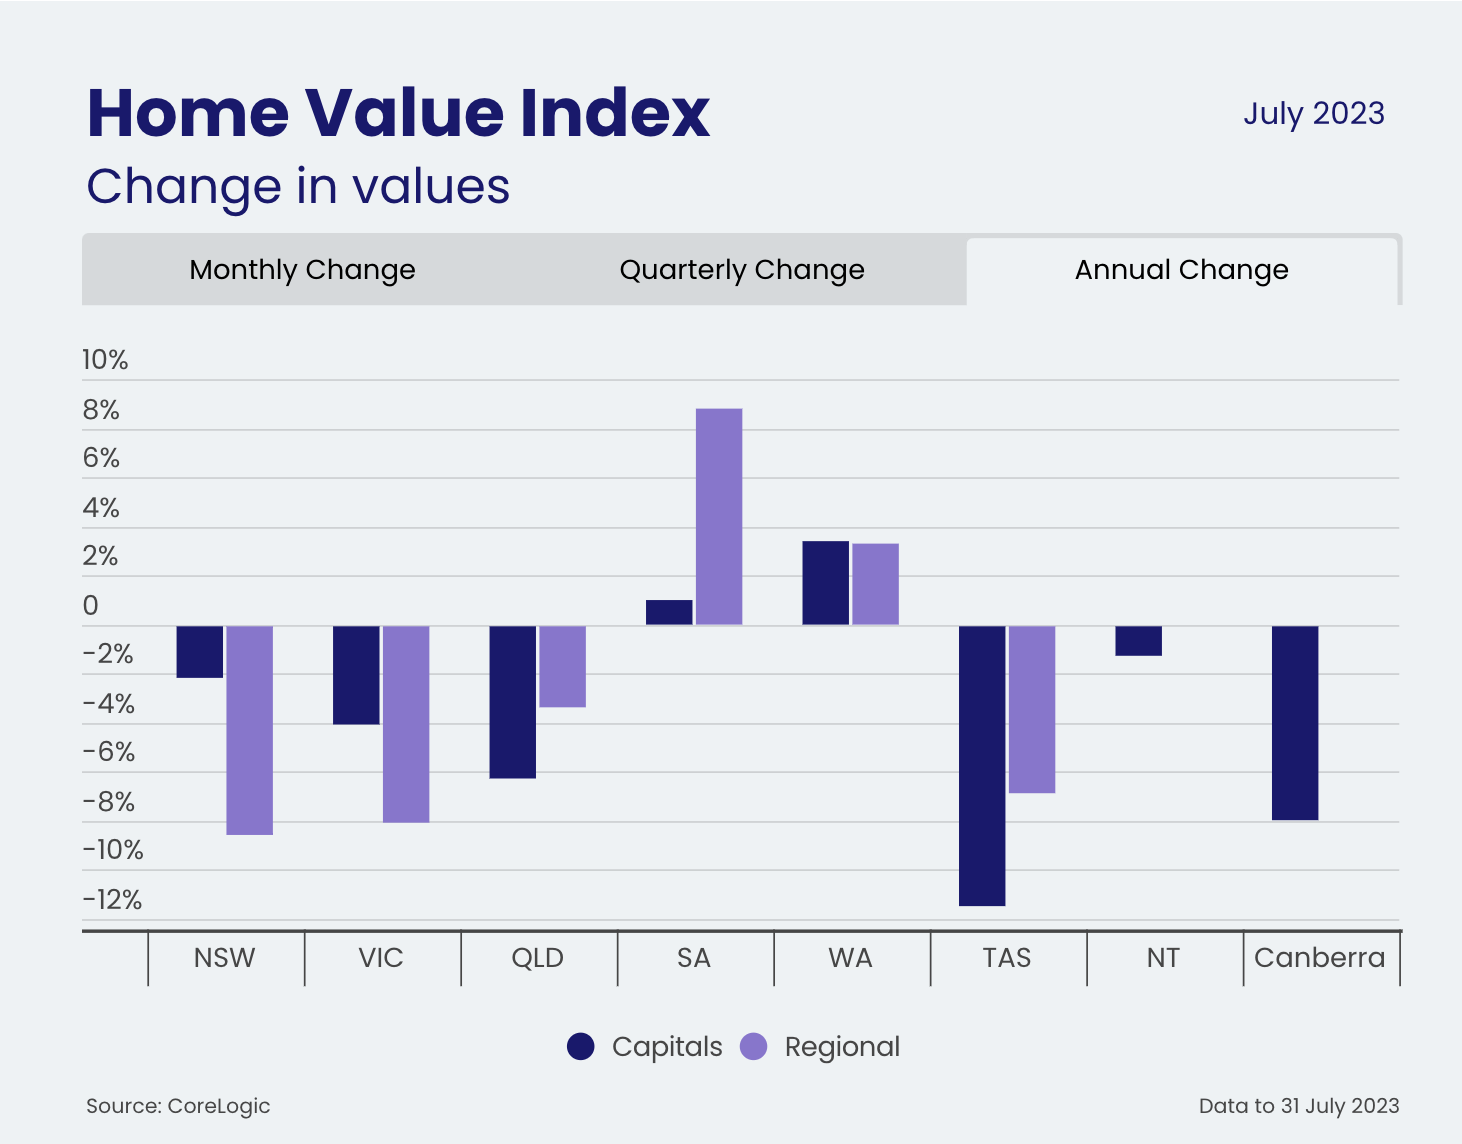
SA +55.1% and WA +32.2% are still riding their high or with WA just now recording -0.3% from its peak. The affordability of these regions is what has made them a desirable choice. Regional QLD +41.8% has recorded the most considerable rebound from its trough of -8.7 rebounding +3.7%. The weakest regional areas are NSW, with a 47.6% peak and trough of -10.3%, recovering +0.9%, VIC, 34.4% Peak, trough of -8.7% remaining unchanged and TAS, the second best performer during the pandemic, with 51.0% peak had a correction of -7.7%, and only +0.3% recovery a year later.
Is there stock returning to the market? Let’s see what Tim Says.
“The positive inflection in housing values is coinciding with roughly average levels of buying activity,” Mr Lawless said. “If we do see the volume of listings increase further, which is likely as we approach spring, that could take some further heat out of the market unless that is offset by a more substantial lift in active buyers.”
CoreLogic Australia Tim Lawless
It is crucial to note that not all markets have the same stock level. Inventory levels are well below -23.3% of the national 5-year average; sales were estimated to be 2.2% above the previous five-year average over the rolling quarter. Nationally, new listings rose 3.7% the 5yr average, but -4.6% below this time last year. Capital cities drove the increase in sales, tracking 5.2% above the five-year benchmark. In contrast, regional sales are estimated at -2.9% below the previous five-year average.
For the investors amongst us. How is your City performing in the rental market?
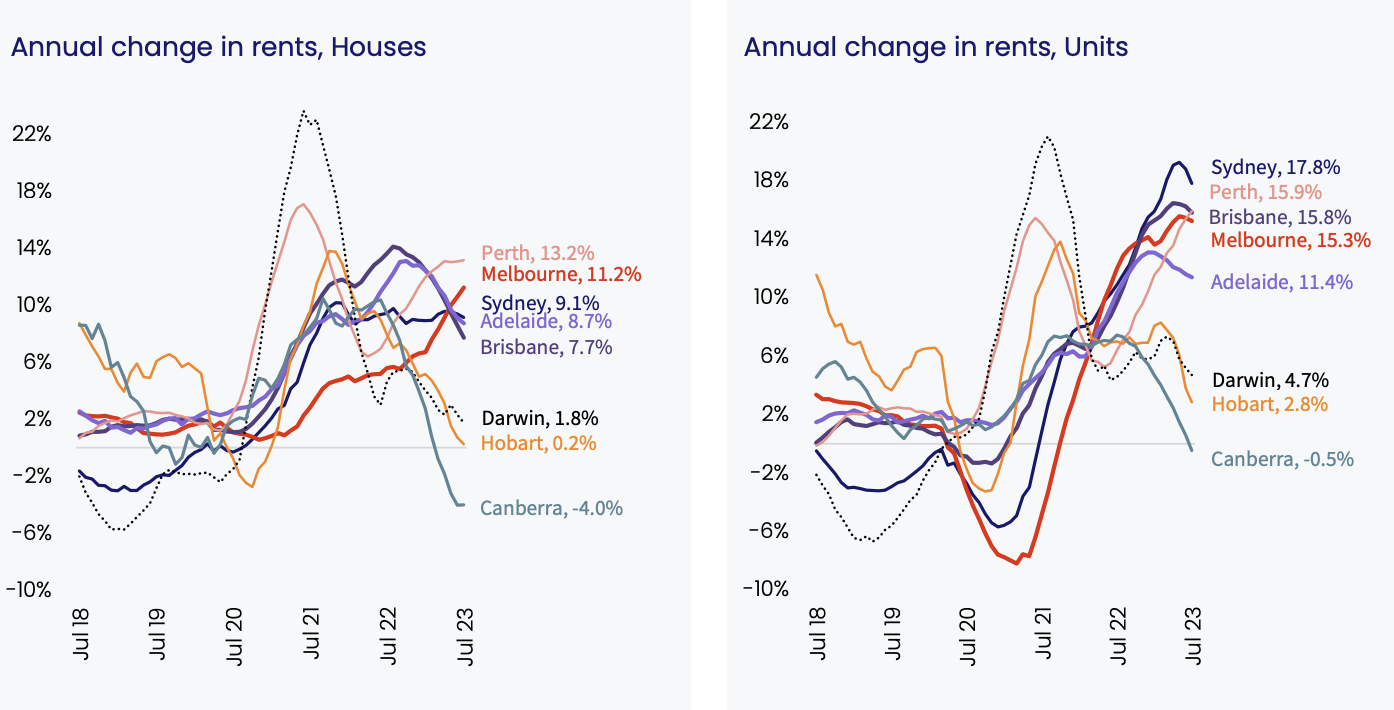
Investors experienced their 35th consecutive month of increases since December 2021, with a rise of +0.6% for July.
Regional areas recorded +0.2%, the lowest monthly rise in regional rents since June 2020. Alongside the easing in rental growth, regional vacancy rates have moved higher, from a low of 1.3% in early 2022 to 1.6% in July.
Although regional vacancy rates have risen, they remain half the decade average (3.2%). Capital City rental growth slowed to 0.8% in July, the lowest monthly rise since December last year. Hobart (- 2.1%) and Canberra (-1.1%) were the only capitals to record a rent drop over the most recent three-month period. These are also the only two capital cities where vacancy rates have risen more than a percentage point over the past 12 months, experiencing a better balance between rental supply and demand.
The most robust rental conditions continue to be seen across the unit sector, where rents were up 2.9% nationally over the three months to July, compared with a 1.9% rise in house rents. They stand our performers in the unit markets of Perth (4.3%), Melbourne (4.0%), and Brisbane (3.8%), with the fastest rate of rental growth over the rolling quarter.
Regional NT rents were down - 6.4% over the past three months, Hobart recorded -2.2% in house rents, and unit rents were -2.0% lower—the trend of people returning to more affordable living now that the pandemic is over since January 2022. The preference for units over houses is likely due to more affordable unit rents, increased demand for medium to high-density accommodation, companies requesting workers return to cities and supply constraints with approvals below the decade average since 2018.
Tim’s Key Take Aways
Overall, the housing market remains resilient to a double-dip downturn
The trend in advertised stock levels will be a key factor determining housing market outcomes.
On the demand side, there is evidence that buyers have become more active despite the highest interest rates since 2012 and sentiment levels holding around GFC lows.
With inflation coming in lower than expected for the June quarter, it’s looking increasingly likely the interest rate cycle is at or near a peak.
Even with interest rates potentially stabilising, borrowers aren’t yet out of the woods. The coming months will see more borrowers experience the full extent of rate hikes as variable rates follow the cash rate with a lag. Also, the transition of more than 800,000 home loans from very low fixed mortgage rates to variable rates at around 6% or higher is currently moving through a peak.
Although the rate hiking cycle is topping out, interest rates aren’t likely to reduce any time soon. Most forecasters don’t see the cash rate coming down until the second half of next year.
But a significant rise in mortgage defaults is unlikely considering the outlook for labour markets.
Housing demand from strong population growth is set to remain a feature over the coming years, and we are yet to see any material supply response.
The Expatriate always tries to make sure all information is accurate. However, when reading our website, please always consider our Disclaimer policy.


